In case you haven’t noticed, we’ve been on the road last November.
We kicked off the Wok Tour at Foodgasm Festival on the 1st of November and wrapped it up at Thursdvys last Friday, 27th November 2015.

Here’s how we did in that time:-
We did 221 boxes more than our target of 1,000 boxes! That's 22.1% more than we expected.
Thank you all for Wokin' It with us, we couldn't have done it without you.
We had a kick ass time serving all of you..Thank You!
[thrive_headline_focus title=”All Your Orders – Analyzed! ” orientation=”left”]
If you didn’t know, we love data here at Wok It (as evidenced here and here before).
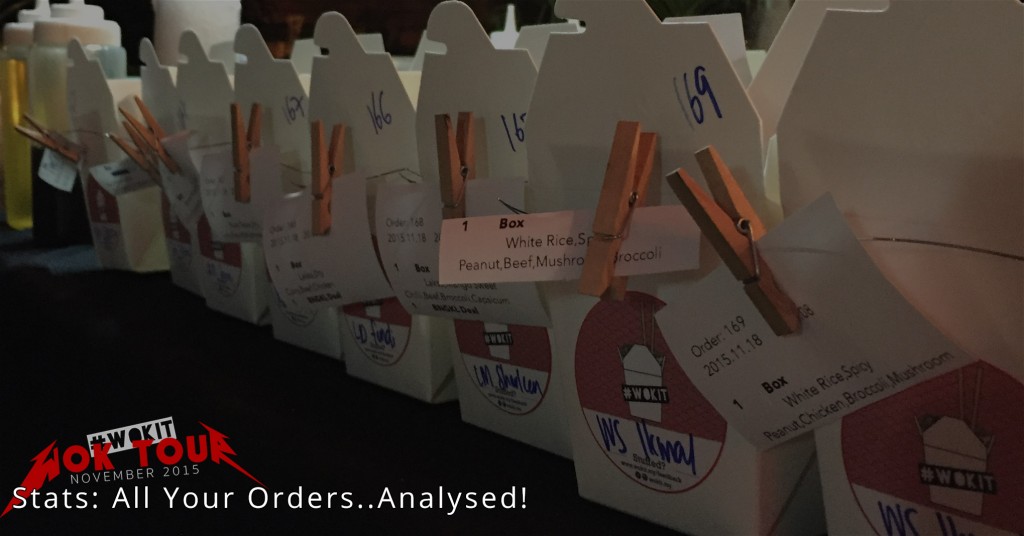
We collect and compile every one of your orders and analyse the data - just to understand YOU better.
Another thing we love is - sharing! So, here are the data we collected broken down into each step of our four step menu.
Step 1: Carbs
Noodles was the top pick with brown rice being the least favourite when it comes to Carbs. No surprises there, really.
What’s interesting is the fact that Laksa has gained popularity since we first introduced it. Could it be because of this post:
Or was it us trying to sell it more.
We sometimes have little tests on what we say to you and analyse your reactions and what you actually end up ordering.
But that’s a story for another post in the future.
Whatever the case, we’re just happy that quite a number of you have a liking for Laksa.
One thing we noticed is, rice either white or brown is more often picked when we operate during the day.
Since most of the events in the Wok Tour was at night, that could possibly explain the low take up rate on rice.
Step 2: Proteins
It’s quite clear what the top 3 favourites are with Proteins.
Beef and Chicken share the top spot with 26% each and prawns at 24%. With squid and cockles being far behind at 9% and 7% respectively.
We were quite surprised by the low take up rate on Squid actually.
Strangely, it reminded us of House Greyjoy's Kraken sigil.
Warning: Game of Thrones references incoming..

and how everyone hates the Greyjoys in The Game of Thrones (more specifically, Theon Greyjoy).

When it came to Cockles, it reminded us of how Theon Greyjoy turned into Reek:

Cockles - get it?
Unfortunately, there isn’t a house with beef or chicken on their sigil to show their dominance on our menu.
Sorry, if you didn’t get the references. The author couldn't resist.
If you didn’t get it, you know what to add to your watchlist.
We're thinking of a few different proteins to add to the menu.
If you have any suggestions, please do share it with us here:
Step 3: Vegetables
There was some significant movement with vegetables from the last time we analysed your orders.
This time around, the numbers give a better picture as it’s spread across nine events instead of just one.
Mushrooms takes the cake with 32%, followed by Broccoli (27%) and Capsicum (15%).
The low percentages of Kailan and Bok Choi doesn’t actually give a true picture as we swapped Kailan with Bok Choi in the middle of the Wok Tour.
Why? Sometimes, we like to change things up with our menu.
We have a feeling that if we had stuck with either Kailan or Bok Choi through out the Wok Tour, the total would probably be more than Beansprouts.
Beansprouts doesn’t stay fresh for long, which leaves us with difficult decision.
Should we switch it to something else to reduce wastage?
Note: We can only purchase on a daily basis and they are only sold in big packs, often more than what we sell.
But at the same time, to some of you, your stir-fries isn’t complete without it.
Dillema, Dillema
What do you think? Should beansprouts be replaced with something else?
If yes, share your suggestions with us:
Step 4: Sauces
The stats for sauces is what makes us most excited!
We take pride in our sauces as it’s all an original - engineered in our kitchen!
Our sauces is what truly gives the unique taste and flavour of Wok It.
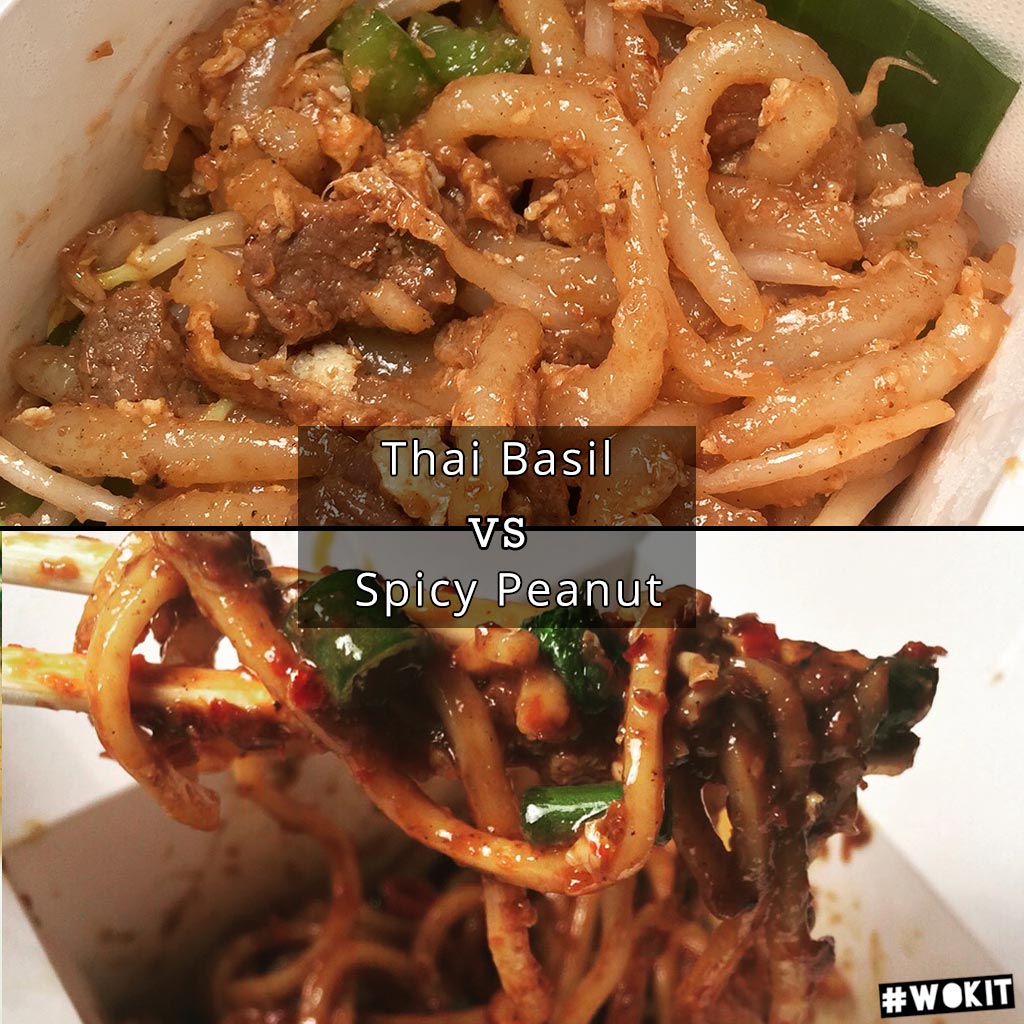
It was a fair fight between Thai Basil and Spicy Peanut in our last Wok Tour Stats update, just before our last venue at Thursdvys.

We had a little wager between us on which would end up on top.
In the end, Thai Basil was the victor albeit marginally at only 1% ahead of Spicy Peanut.
We’re also happy to see that it was quite evenly spread among the sauce selections.
This is validation that what we’re offering is being accepted by you.
Have you got any ideas for a new sauce? Share it with us in the comments section below.
[thrive_headline_focus title=”New Sides – Shake It!” orientation=”left”]
We also introduced our new sides, Shake It, during the Wok Tour.
We're happy to say that it was quite a hit this Wok Tour! Here's how it did:
Shake It - Stats
Although there are 9 events altogether in the Wok Tour, we only served it in 8.
We initially wanted to first introduce it at Foodgasm Festival, but due to technical difficulties (no electricity!) and space constraints, we decided it was best not to.
The average number of Shake It orders per event is 17.75 which we are quite happy with.
Based on these numbers, Shake It was served roughly 11% for every Wok It box served.
If you noticed, most of the items on our menu are quite flexible where it's easy for us to switch things out.
In this case, the base for Shake It could be changed from mushrooms to something else, like squid, chicken, etc.
We also have the flexibility of changing things up with the seasonings that we can offer.
How do we decide on what should stick on the menu?
In the end, it all boils down to you - we let the data validate our ideas and chart the course for our menu and everything else that we do.
[thrive_headline_focus title=”We Owe It To You.. ” orientation=”left”]
There you have it folks - all 1,221 of your orders, analysed!
The Wok Tour was a great success for us and it was all because of you - Thank you!
We also owe it to kind people that accepted us in to their respective joints for us to share the Wok It Experience with you.
If you’re ever in these areas and looking for a good coffee joint, this is the only list you’ll ever need:-
Area | Name |
|---|---|
Petaling Jaya | Roast & Grind |
Petaling Jaya | Coffee Collective |
Taman Tun Dr Ismail | |
Taman Tun Dr Ismail | Thursdvys |
Damansara Heights | Mollydooker's Coffee |
Bangsar | Grind 22 |
Subang Jaya |
Check 'em out folks, we can truly vouch for every single one on the list!
[thrive_headline_focus title=”Before You Go.. ” orientation=”left”]
One last thing, we also used the Wok Tour to validate some of the hypotheses and assumptions that we had.
We’re thrilled to say that we’ve had some very positive data so far.
Positive enough to say that we may have some big news for you.

Could it be that you can soon have the Wok It Experience on any day of the week?
Maybe..
Stay tuned to find out!


 Seen here: Laksa+Mango Sweet Chilli+Beef+Brocolli+Beansprouts . Catch us at @grind22bangsar tonight, from 7pm till late. For more details, visit: https://wokit.my/event/woktourgrind22 #WokIt #WokItMY #Laksa
 . Catch us at @bngkl tonight (8pm - 12am), while we'll be at @soukabakes, Subang tomorrow and Friday (7pm - 12am). #WokIt #WokItMY #WokTour